Clinical-Trial-Patient-Selection-Optimization
Clinical Trial Patient Selection & Admission Prediction
Tool: Orange Data Mining | Domain: Healthcare & Clinical Research
📌 Executive Summary
This project focuses on the strategic application of Data Mining to enhance Clinical Trial Patient Selection. By leveraging Orange Data Mining software, I developed a pipeline to analyze patient profiles and predict Admission Types (Elective, Urgent, Emergency). In the context of clinical research, this methodology helps identify patient stability and risk levels, which is critical for optimizing recruitment processes and ensuring trial safety.In the context of clinical research, predicting admission types is critical: it allows researchers to proactively identify patient stability, screen out highly unstable candidates, reduce trial dropout rates, and ensure overall patient safety
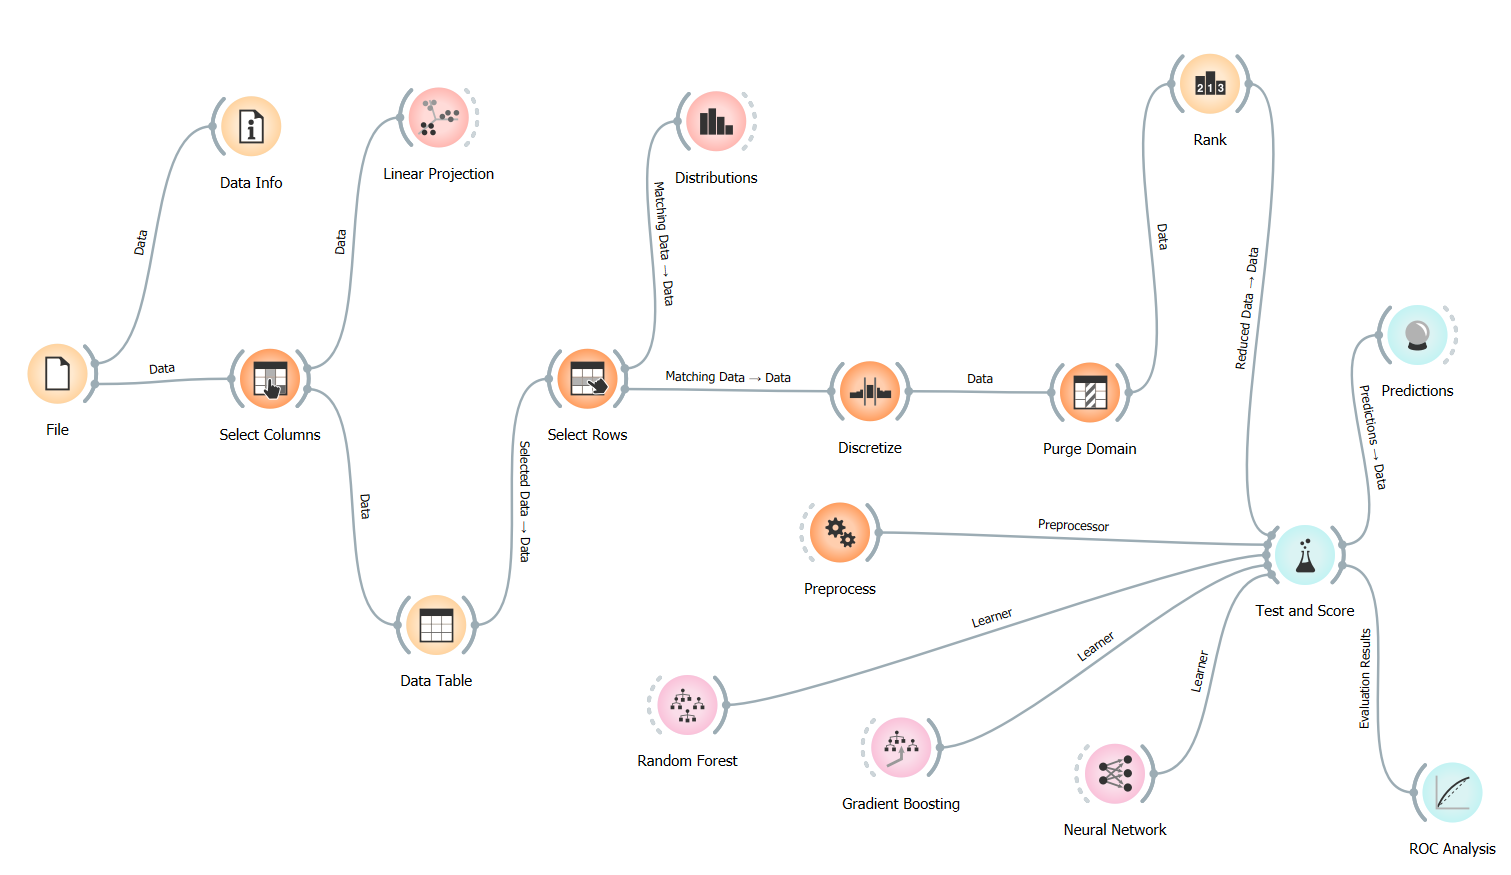
🛠️ The Technical Workflow
The project utilizes a structured modular flow in Orange, designed to ensure data integrity and clinical relevance.
-
Data Preprocessing & Governance
- Select Columns: I filtered out non-predictive metadata (such as Patient Names and Doctor IDs) to focus strictly on clinical and demographic features.
- Discretize: Continuous variables like Age and Billing Amount were binned into categories. In healthcare, predicting outcomes for specific age groups (e.g., Geriatric vs. Pediatric) is more actionable than individual years.
- Purge Domain: This was a critical “Data Cleaning” step. It removed empty values and redundant categories that remained after filtering, ensuring the machine learning models weren’t confused by “ghost data” or noise.
-
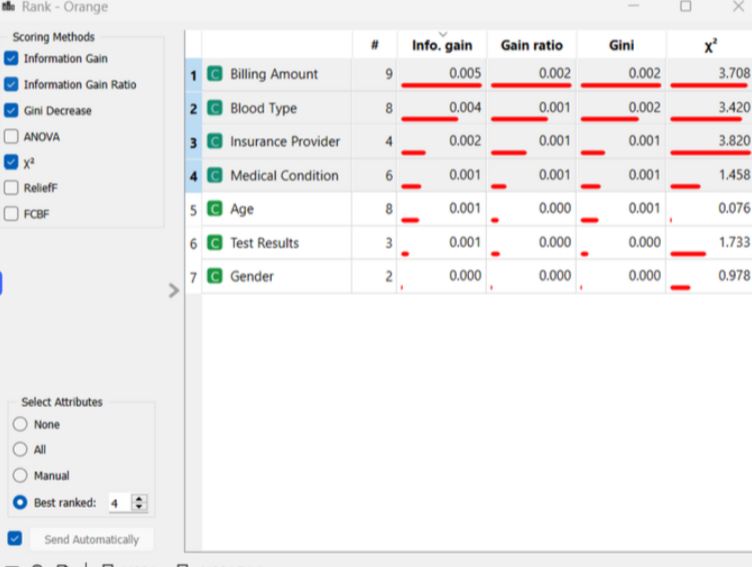
Feature Importance (The “Rank” Node)
I utilized the Rank node to score the impact of each attribute on the target variable (Admission Type) using Information Gain and Gini Decrease. This identified which patient traits such as medical conditions or insurance providers—served as the strongest indicators for admission urgency.
📊 Model Evaluation & Results
I compared high-performance algorithms including Neural Networks and Gradient Boosting to determine the best predictive fit for the healthcare dataset.
📊 Supplementary Analysis (Excel)
In addition to the Orange outputs, I developed a comprehensive Model Performance Analysis Matrix in Excel. This sheet includes:
- Confusion Matrix Calculations: Breakdown of True Positives vs. False Positives across all three admission categories.
- Comparative Metrics: Side-by-side evaluation of Neural Networks vs. Ensemble methods.
- Cost-Benefit Projection: A business-layer analysis of how model accuracy impacts hospital resource allocation.
🔍 Analytical Discussion: Why 33% Accuracy?
In a 3-class classification problem (Urgent, Emergency, Elective), a random guess yields 33.3% accuracy. My models hovered around this baseline, providing a vital Data Business Insight:
-
Feature Sufficiency: The results prove that demographic and billing data alone are not strong enough predictors for medical admission types in this synthetic dataset.
-
Clinical Complexity: Real-world emergency admissions are often stochastic (random) events.
-
Strategic Recommendation : This model serves as a baseline. For real-world implementation, I recommend integrating dynamic Electronic Health Records (EHR) such as vital signs, lab results, and historical comorbidities to move the predictive AUC well beyond this baseline.”
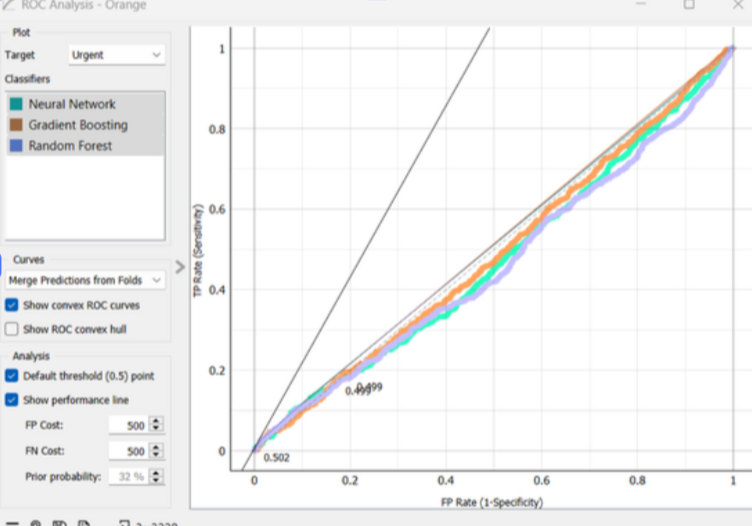
📈 Visualizing Decision Boundaries
I used ROC Analysis to evaluate the trade-off between “False Positives” and “True Positives.” In healthcare, missing an emergency (False Negative) is more costly than a false alarm; this analysis allows us to tune the model for patient safety.
🌟 Why this project demonstrates my value as a Healthcare Data Business Analyst:
- Industry Focus: I applied data mining specifically to solve a Clinical Trial recruitment problem.
- Technical Proficiency: Expertise in the Orange platform for rapid prototyping and complex data workflows.
- Analytical Honesty: I provide a deep-dive analysis of why models perform a certain way, rather than just reporting numbers.
- Data Integrity: I understand how to use tools like Purge Domain to maintain “clean” data for business reporting.
🔍 Technical Deep Dive & Visual Evidence
To validate the model findings, I conducted a granular review of the dataset and algorithm performance metrics.
Feature Importance & Ranking
Using Information Gain and Gini Decrease, I identified the primary drivers in the dataset. While the predictive power was balanced across classes, “Billing Amount” and “Blood Type” emerged as the most significant features for categorization.
Model Confidence (ROC Analysis)
The ROC curves for Neural Networks and Gradient Boosting demonstrate the “Random Guess” baseline (~0.50 AUC). This visualization is crucial for healthcare stakeholders to understand that additional clinical data points are required for a deployable model.
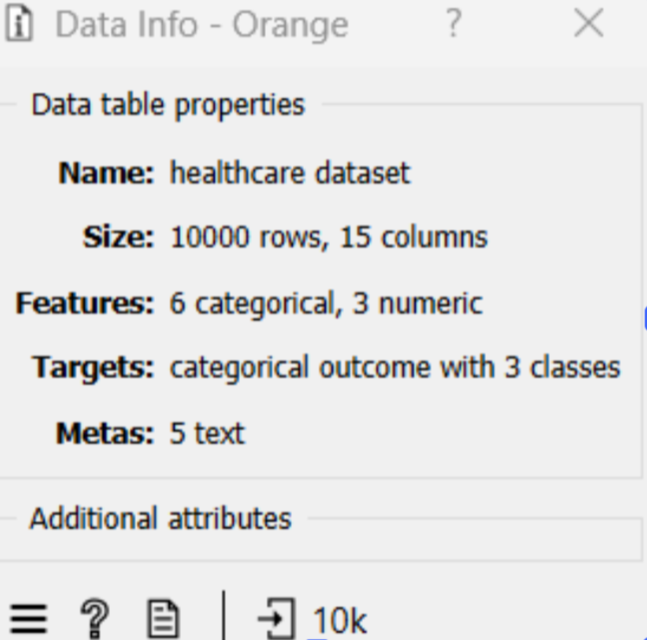
Dataset Composition
The model was trained on 10,000 patient records with a mix of categorical and numeric features, ensuring a robust sample size for cross-validation.
📂 Repository Structure
📂 data/: Raw Patient_Health_Records_Dataset.csv.
📂 workflow/: The Admission_Prediction_Workflow.ows (Orange file).
📂 docs/: Project_Report_and_Analysis.pdf and Model_Performance_Analysis_Matrix.xlsx.
📄 README.md: Project overview and results.
📄 requirements.txt: Software requirements.
🖼️ workflow_preview.png: Visual representation of the data pipeline.
👤 Author
Tejashwini Saravanan LinkedIn