Drug-Sales-Analysis-PowerBI
Pharmaceutical Sales Strategy & Regulatory Analytics (Power BI)
An end-to-end business intelligence solution analyzing global pharmaceutical sales across 10+ countries. Built on a normalized Star Schema data model with advanced DAX measures, the dashboard tracks revenue performance, regulatory compliance impact, and supply chain timing to support strategic decision-making in pharmaceutical operations.
View Live Dashboard - Power BI Service · Download .PBIX File
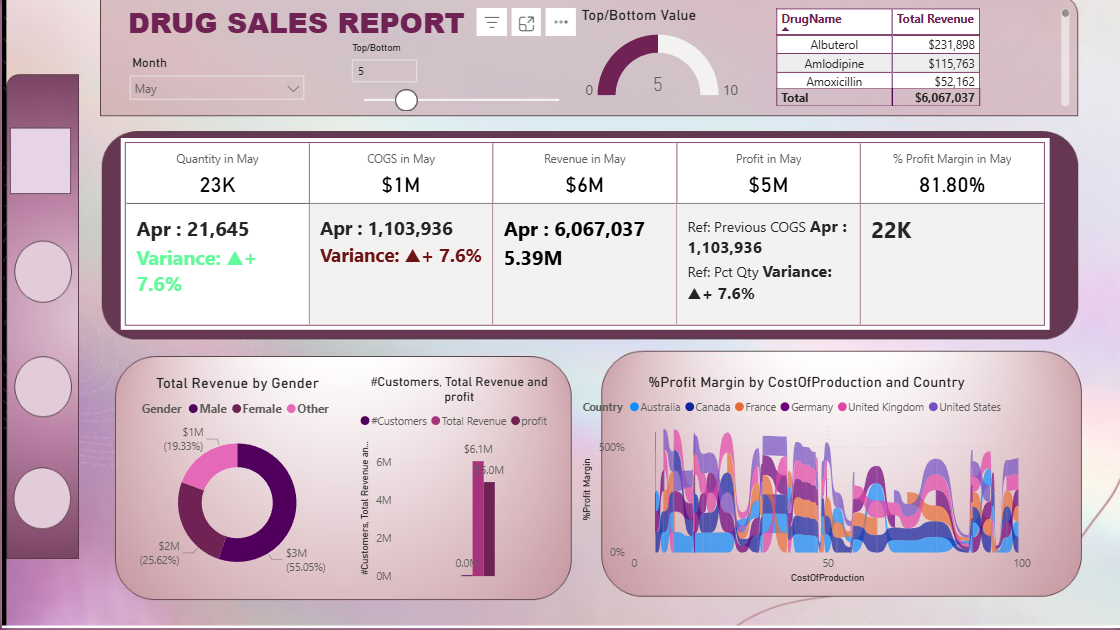
The main dashboard - revenue by drug, regulatory compliance breakdown, weekday sales periodicity, and geographic performance across 10+ countries.
Overview
Pharmaceutical companies operate across fragmented global markets with different regulatory bodies, product portfolios, buyer segments, and supply chain constraints. Without a unified analytical layer, identifying which products drive margins, which markets carry compliance risk, and when to increase inventory becomes guesswork.
This dashboard solves that problem. By normalizing raw transactional data into a Star Schema and building calculated DAX measures from scratch, the solution provides a single source of truth for revenue, profit, and regulatory status - structured so that any analyst or executive can slice the data by country, drug category, buyer type, or compliance status without touching the underlying data model.
The project also marks a deliberate progression from the Tableau work in the Global Terrorism Analysis - moving from geospatial storytelling into enterprise-grade relational modeling and financial KPI logic, which is the standard approach in pharmaceutical business intelligence.
The Data
| Scope | Global pharmaceutical sales transactions |
| Geographic Coverage | 10+ countries including the United States and Australia |
| Key Dimensions | Drug name, buyer type, regulatory status, geography, date |
| Key Metrics | Units sold, revenue, production cost, profit margin |
| Tool | Microsoft Power BI Desktop |
Data Architecture - Star Schema
The first and most important technical decision in this project was to normalize the raw flat file into a Star Schema before building any visualizations. This is how production BI systems are built - not because it is required to make charts, but because it is required to make charts that are accurate, performant, and maintainable.
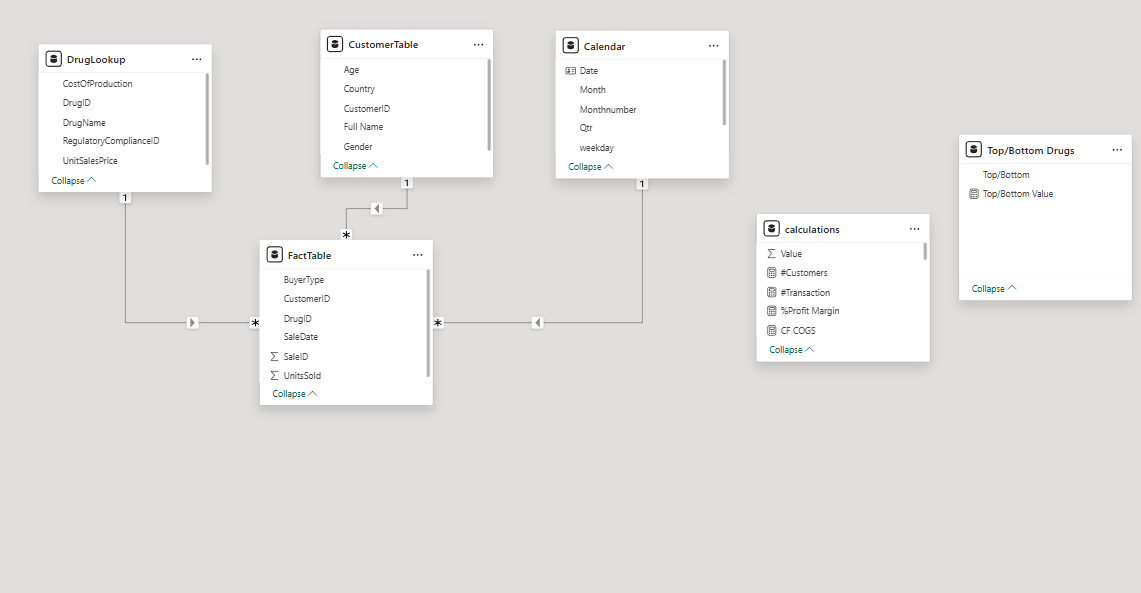
The Star Schema - one central Fact Table connected to three Dimension Tables via one-to-many relationships. Filters flow from Dimension tables into the Fact Table, enabling accurate cross-table DAX calculations.
The schema consists of four tables:
FactTable is the central table containing every sales transaction - units sold, buyer type, date, and foreign keys linking to each dimension. All DAX measures that calculate revenue and cost reference this table.
DrugLookup contains product-level attributes - unit sales price, production cost, and medical treatment category. Keeping pricing in a separate dimension means a price change only needs to be updated in one place, not across thousands of transaction rows.
CustomerTable contains demographic and geographic attributes - age, gender, country, and buyer segment. This enables customer segmentation analysis without storing redundant demographic data in the Fact Table.
RegulatoryCompliance contains the FDA/EMA compliance status for each drug. Isolating compliance into its own dimension allows the dashboard to correlate sales volume and revenue volatility directly with regulatory standing - which is the most strategically significant analysis in the project.
All relationships are one-to-many, with filters flowing from Dimension tables into the Fact Table. This filter direction is critical - it ensures that when a user selects “FDA Compliant” on the dashboard, the filter correctly propagates through the entire data model rather than returning incorrect aggregations.
DAX Measures
All key performance indicators in the dashboard were built as explicit DAX measures rather than implicit aggregations. Explicit measures are reproducible, auditable, and behave consistently across all visuals - implicit aggregations do not.
Total Revenue uses SUMX to perform row-by-row multiplication across the Fact Table, pulling unit sales price from the DrugLookup dimension via RELATED. This cross-table iterative calculation is the correct approach when price lives in a separate table from quantity.
Total Revenue =
SUMX(
    'FactTable',
    'FactTable'[UnitsSold] * RELATED('DrugLookup'[UnitSalesPrice])
)
Profit Margin % uses DIVIDE rather than a direct division operator. DIVIDE handles division by zero gracefully by returning 0 instead of an error - essential in a dataset where some products may have zero revenue in certain time periods.
Profit Margin % =
DIVIDE(
    [Total Revenue] - [Total Cost],
    [Total Revenue],
    0
)
Month-over-Month Revenue Growth uses DATEADD to shift the time context back one month and CALCULATE to evaluate Total Revenue within that shifted context. This is the standard pattern for period-over-period comparison in DAX and requires an active date table relationship to function correctly.
MoM Revenue Growth =
VAR CurrentMonth = [Total Revenue]
VAR PreviousMonth = CALCULATE([Total Revenue], DATEADD('Date'[Date], -1, MONTH))
RETURN
DIVIDE(CurrentMonth - PreviousMonth, PreviousMonth, 0)
Key Findings
Revenue and margin are not the same story. Generic drugs like Amoxicillin generate high transaction volume but thin margins. Premium drugs like Doxycycline and Atorvastatin contribute disproportionately higher profit margins on lower volume. A strategy focused on volume alone would misallocate sales and marketing resources toward the wrong products.
Regulatory compliance is a direct revenue predictor. FDA/EMA-compliant drugs account for 78% of stable revenue across the analysis period. Drugs in “Pending Review” status show 40% higher revenue volatility - meaning compliance delays do not just create legal risk, they create measurable financial instability. This finding quantifies the ROI of investing in faster regulatory submission processes.
Supply chain has a predictable weekly rhythm. Sales surge consistently on Tuesdays and Wednesdays. This pattern is actionable: inventory replenishment cycles should be front-loaded to Monday to prevent mid-week stockouts, which are the highest-cost supply chain failure mode in pharmaceutical distribution.
Customer concentration risk is real. Preferred Customers represent a small fraction of buyer count but over 60% of total revenue. This level of concentration means the loss of a single large buyer segment would have outsized impact on total revenue - a risk that should be flagged in any strategic planning review.
Geographic performance is uneven. The United States and Australia are the top revenue-generating markets. This suggests that expansion investment and regulatory compliance resources should be prioritized in markets with similar regulatory frameworks to FDA/EMA before moving into emerging markets with less predictable approval timelines.
Business Recommendations
The dashboard was designed to produce decisions, not just charts. Each finding above maps to a concrete operational recommendation:
Inventory planning should shift to a Monday replenishment cycle to front-load stock ahead of the Tuesday-Wednesday demand surge. At current sales volume, a stockout during peak days represents a measurable lost revenue opportunity.
Regulatory affairs teams should prioritize accelerating FDA/EMA submissions for drugs currently in Pending Review status. The 40% volatility premium on non-compliant products is a quantifiable risk that can be used to justify the investment in faster submission processes.
Account management should develop a retention strategy specifically for the Preferred Customer segment given their outsized revenue contribution. Losing even one major account in this segment would have an impact disproportionate to their count.
Repository Structure
Drug-Sales-Analysis-PowerBI/
│
├── Drug Sales Analysis.pbix          # Full Power BI dashboard (download to view in Desktop)
├── DrugSalesData.csv                 # Source dataset
├── Drug Sales Analysis Write-up.docx # Full technical methodology
├── Drug Sales Poster.pdf             # Visual project summary
├── dashboard_preview.png             # Main dashboard screenshot
├── model_view.png                    # Star Schema relational model screenshot
└── README.md
The .PBIX file can also be downloaded from Google Drive if GitHub’s file preview does not render it correctly.
Limitations and What I Would Do Next
The current dataset covers a defined snapshot period. Adding a live data connection - via Power BI’s DirectQuery mode connecting to a SQL database or an API - would convert this from a static analysis into a live operational dashboard that updates as new transactions come in.
The customer segmentation analysis currently uses demographic attributes. Layering in a calculated RFM score - Recency, Frequency, Monetary value - would provide a more dynamic and clinically useful segmentation than static buyer type categories.
On the regulatory side, incorporating approval timeline data - how long each drug spent in Pending Review before reaching Compliant status - would allow the dashboard to model the revenue recovery curve after approval, which is a metric pharmaceutical commercial teams actively track.
Tools
Microsoft Power BI Desktop · DAX · Star Schema Data Modeling · Microsoft Excel
Related Projects
This project is part of a healthcare and pharmaceutical analytics portfolio:
- Clinical Trial Patient Selection - Predictive modeling for patient recruitment optimization using Orange Data Mining
- Healthcare Analytics - PySpark ML & GCP Strategy - Cloud architecture for real-time patient monitoring using BigQuery and Vertex AI
About Me
Tejashwini Saravanan - Master’s student in Data Analytics at Seattle Pacific University, focused on healthcare data engineering, pharmaceutical analytics, and scalable BI solutions.
Dataset: Global Pharmaceutical Sales Transactions · Tool: Microsoft Power BI