wine-reviews-text-mining-rapidminer
Wine Reviews — Text Mining & Analysis
Uncovering patterns in 130,000+ wine reviews through data mining techniques
[](https://rapidminer.com/) [](LICENSE) [](https://www.kaggle.com/datasets/zynicide/wine-reviews) []() []()
A graduate-level text mining project applying Correlation Analysis, Association Rule Mining, and K-Means Clustering to a dataset of 130K+ wine reviews collected via Twitter — built entirely in RapidMiner Studio.
Table of Contents
- Project Overview
- Repository Structure
- Dataset
- Tools & Technologies
- RapidMiner Process Pipeline
- Analysis & Results
- Additional Visualizations
- Key Findings Summary
- Insights & Business Value
- Limitations & Future Work
- Author
- License
Project Overview
This project applies text mining and data analysis techniques to a large corpus of wine reviews collected via Twitter. The goal is to uncover hidden patterns in wine data — from how price relates to quality, to the most common grape blends and geographic clusters.
The analysis explores three core research questions:
- Does a wine’s price depend on reviewer ratings?
- Which province produces the best-rated wines?
- What are the most commonly used grape blends in wine production?
Repository Structure
wine-reviews-text-mining-rapidminer/
│
├── Wine_Reviews.xlsx          # Dataset (sourced from Kaggle)
├── Wine_Review_.rmp           # RapidMiner process file
├── Wine_Reviews.pdf           # Full project presentation (slides)
│
└── visualizations/
    ├── process .png            # RapidMiner workflow diagram
    ├── Data From Process .png  # Clustered output data
    ├── statistics .png         # Dataset statistics overview
    ├── correlation Matrix .png # Correlation matrix (points vs price)
    ├── bell curve - plot .png  # Price distribution (bell curve)
    ├── Histogram .png          # Points frequency by taster
    ├── box plot .png           # Points distribution by province
    ├── scatter plot .png       # Winery distribution by region
    └── Cluster Model .png      # K-Means clustering result
Dataset
| Attribute | Details |
|---|---|
| Source | Kaggle — Wine Reviews |
| Records | ~9,000 filtered records (original: 130K+) |
| Attributes | 14 total (variety, location, winery, price, points, description, taster Twitter handle, etc.) |
| Numerical | points (0–100 scale), price (USD) |
| Text | description (free-text taster reviews from Twitter) |
Key Statistics:
| Metric | Points | Price |
|---|---|---|
| Min | 80 | $4 |
| Max | 100 | $2,013 |
| Average | 89.15 | $37.58 |
| Std Dev | 2.83 | $27.25 |
Missing values handled via the Replace Missing Values operator in RapidMiner.
Tools & Technologies
| Tool | Purpose |
|---|---|
| RapidMiner Studio | End-to-end data mining pipeline |
| Microsoft Excel | Dataset storage and initial review |
| Kaggle | Dataset source |
RapidMiner Process Pipeline
The full process was built in RapidMiner Studio and consists of three parallel sub-pipelines:
1. Correlation Analysis Pipeline
Retrieve Wine Reviews → Select Attributes → Filter Examples → Correlation Matrix
Analyzes the statistical relationship between points and price.
2. Association Rule Mining Pipeline
Retrieve Wine Reviews → Replace Missing Values → Select Attributes →
Process Documents → Numerical to Binominal → FP-Growth → Create Association Rules
Mines frequent itemsets from review text to discover grape variety patterns.
3. Clustering Analysis Pipeline
Retrieve Wine Reviews → Replace Missing Values → Select Attributes →
Process Documents → Clustering (K-Means)
Groups wines into natural clusters based on descriptive language in reviews.
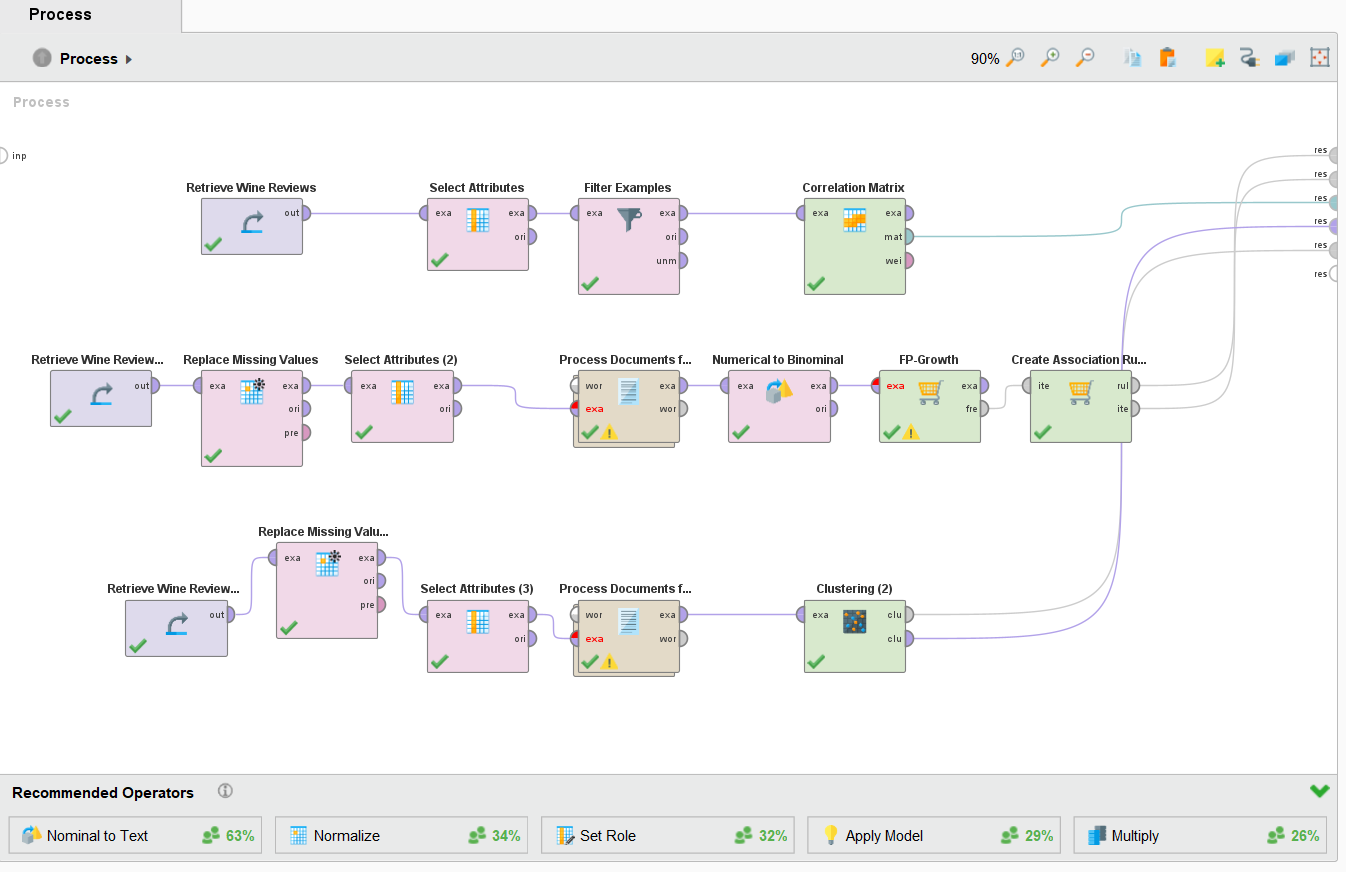
Full RapidMiner process pipeline across all three analyses
Analysis & Results
Correlation Analysis
A Pearson Correlation Matrix was computed between points and price.
| Attributes | Points | Price |
|---|---|---|
| Points | 1.000 | 0.430 |
| Price | 0.430 | 1.000 |
Finding: Points and price show a weak positive correlation (r = 0.43), meaning higher-rated wines tend to cost more, but price alone is not a strong predictor of quality.
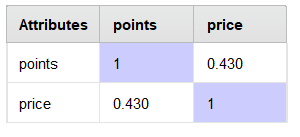
Correlation matrix — points vs price
Price Distribution
A bell curve of wine prices for US wines shows a near-normal distribution centered around $30–$40, confirming that most wines fall in the affordable-to-mid range.
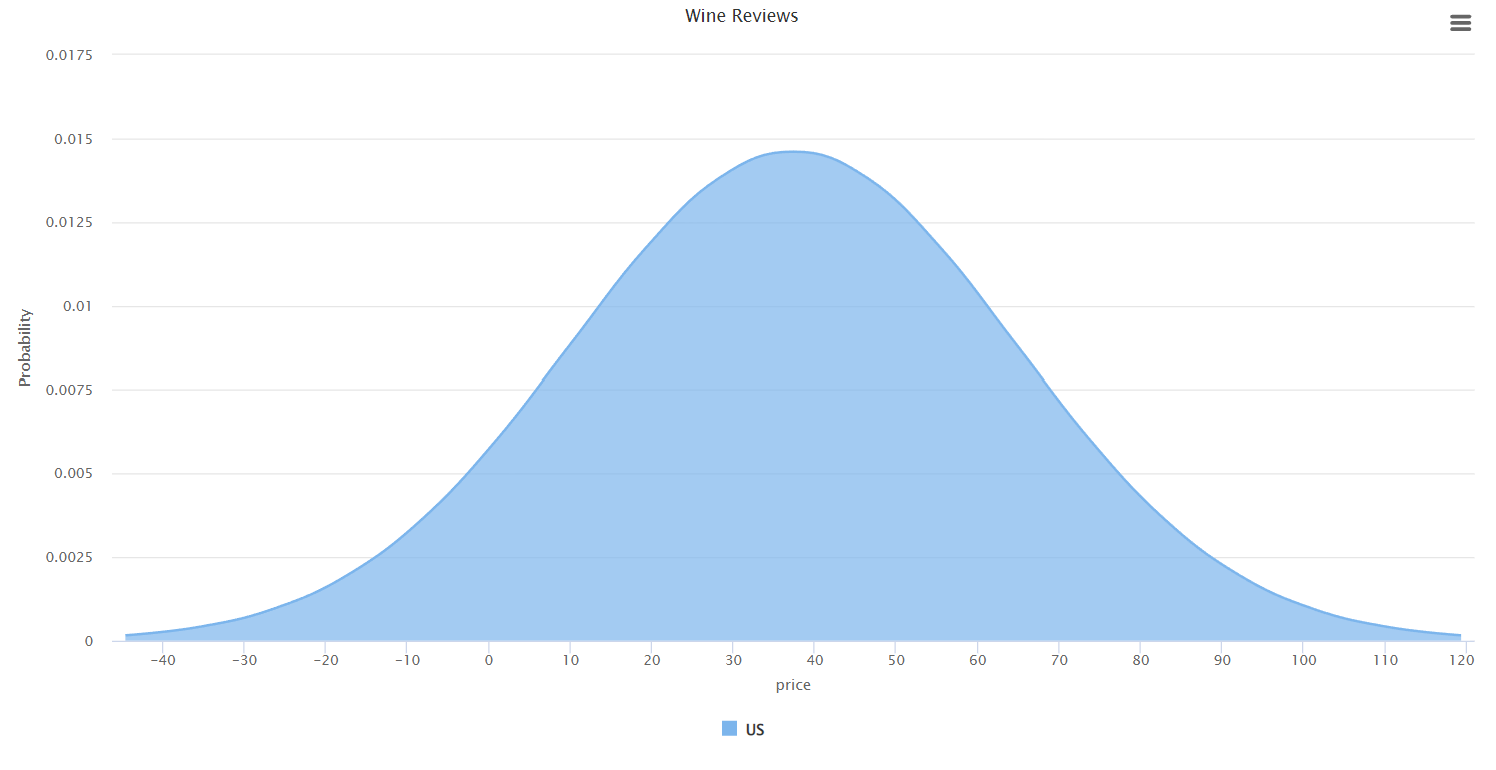
Price distribution bell curve — US wines
Points by Province (Box Plot)
Comparing wine quality scores across US provinces:
| Province | Median Points | Notes |
|---|---|---|
| California | ~90 | Highest median |
| Oregon | ~89 | Strong performer |
| Washington | ~89 | Consistent quality |
| New York | ~84 | Lower range |
Finding: California produces the highest-rated wines on average among US provinces.
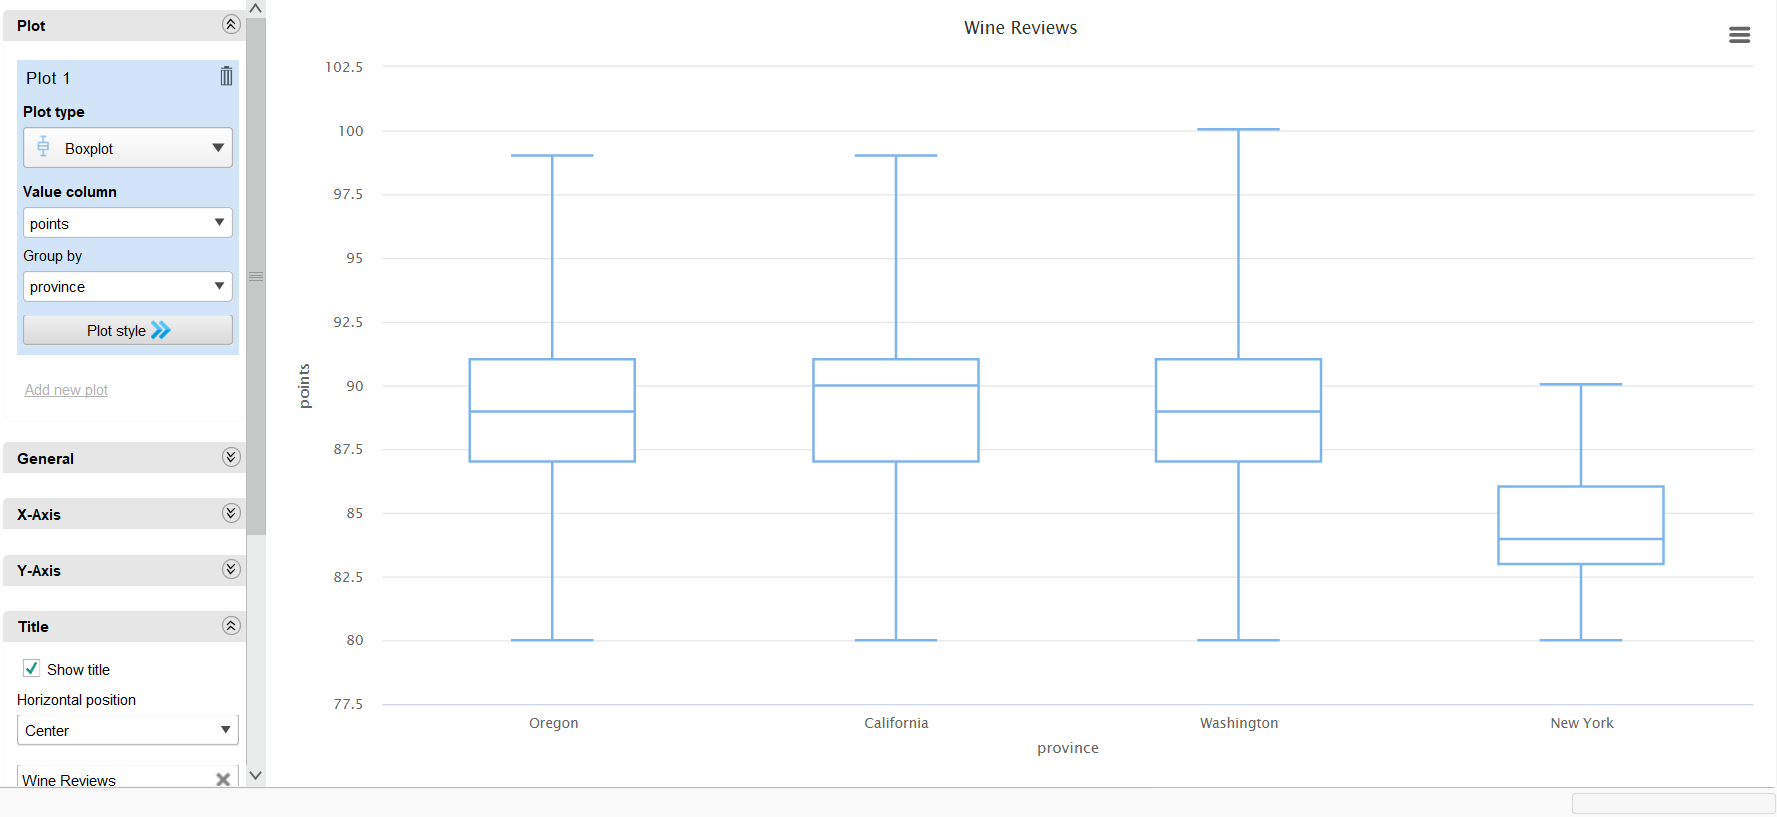
Points distribution by province — box plot
Association Rule Mining
Using the FP-Growth algorithm, frequent patterns in wine descriptions were extracted. Top association rules discovered:
| Rule | Confidence |
|---|---|
[sparkling] → [blend] |
0.955 |
[noir] → [pinot] |
0.997 |
[bordeaux] → [blend] |
1.000 |
[style, bordeaux] → [blend] |
1.000 |
[blanc] → [sauvignon] |
0.784 |
Finding: Bordeaux Blend is the most commonly referenced grape blend in wine descriptions, with 100% confidence in multiple rules.
K-Means Clustering
The wine reviews were grouped into 5 distinct clusters based on text description features:
| Cluster | Size | Flavor Profile |
|---|---|---|
| Cluster 0 | 32,235 | General / Mixed |
| Cluster 1 | 21 | Citrus notes |
| Cluster 2 | 15 | Fruity |
| Cluster 3 | 61 | Berry / Spice |
| Cluster 4 | 81 | Brand-focused |
Performance Vector:
- Average within centroid distance: -1.009
- Davies-Bouldin Index: -12.444
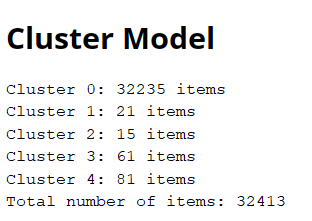
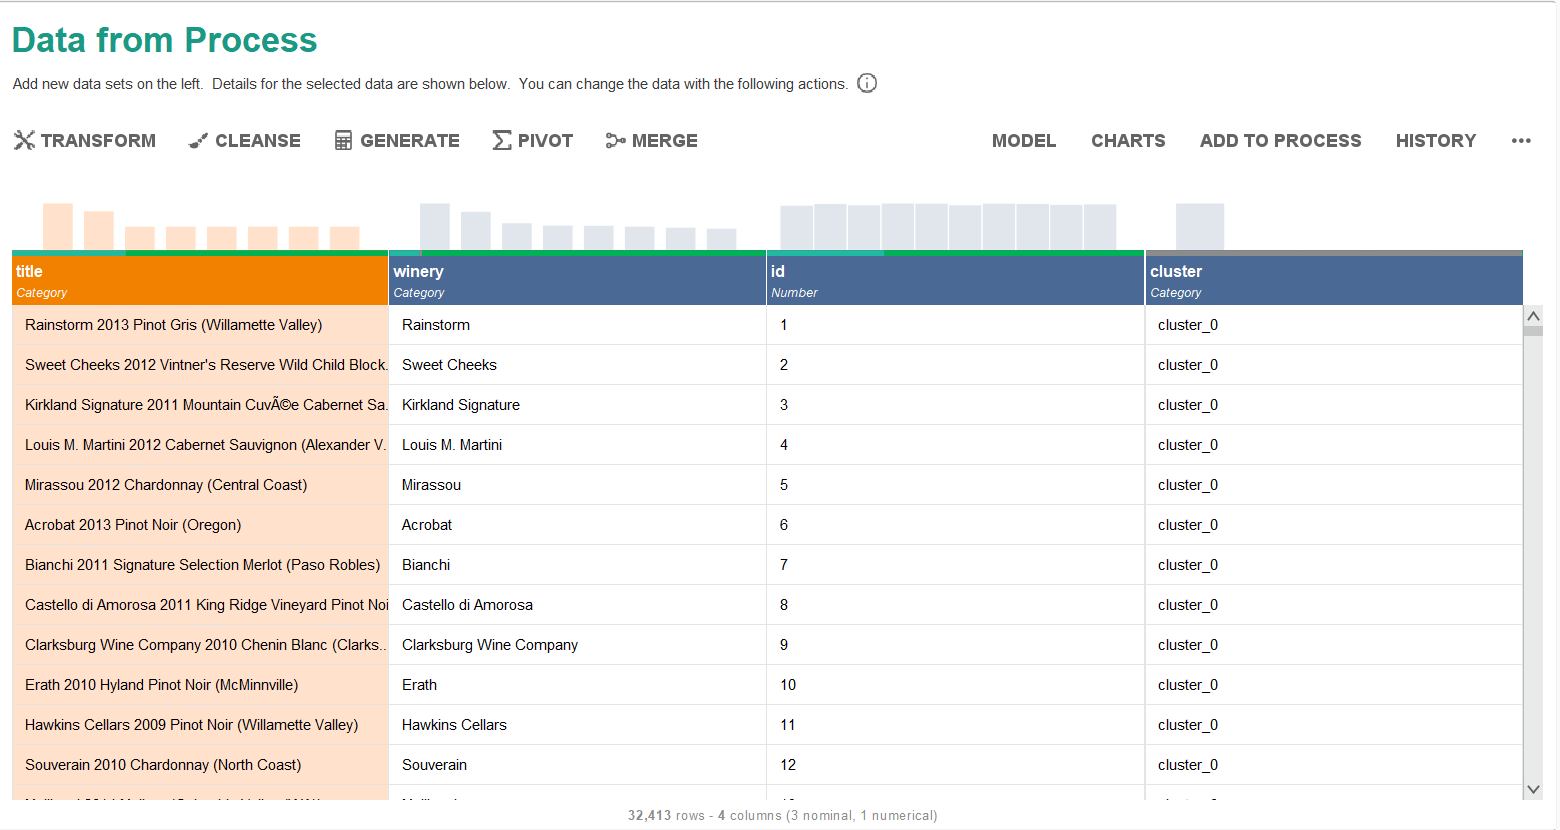
Cluster model output (left) — Clustered data from process (right)
Additional Visualizations
Histogram — Points Frequency by Taster
Most reviews fall between 87–92 points, with @vboone and @mattkettmann being the most prolific reviewers.
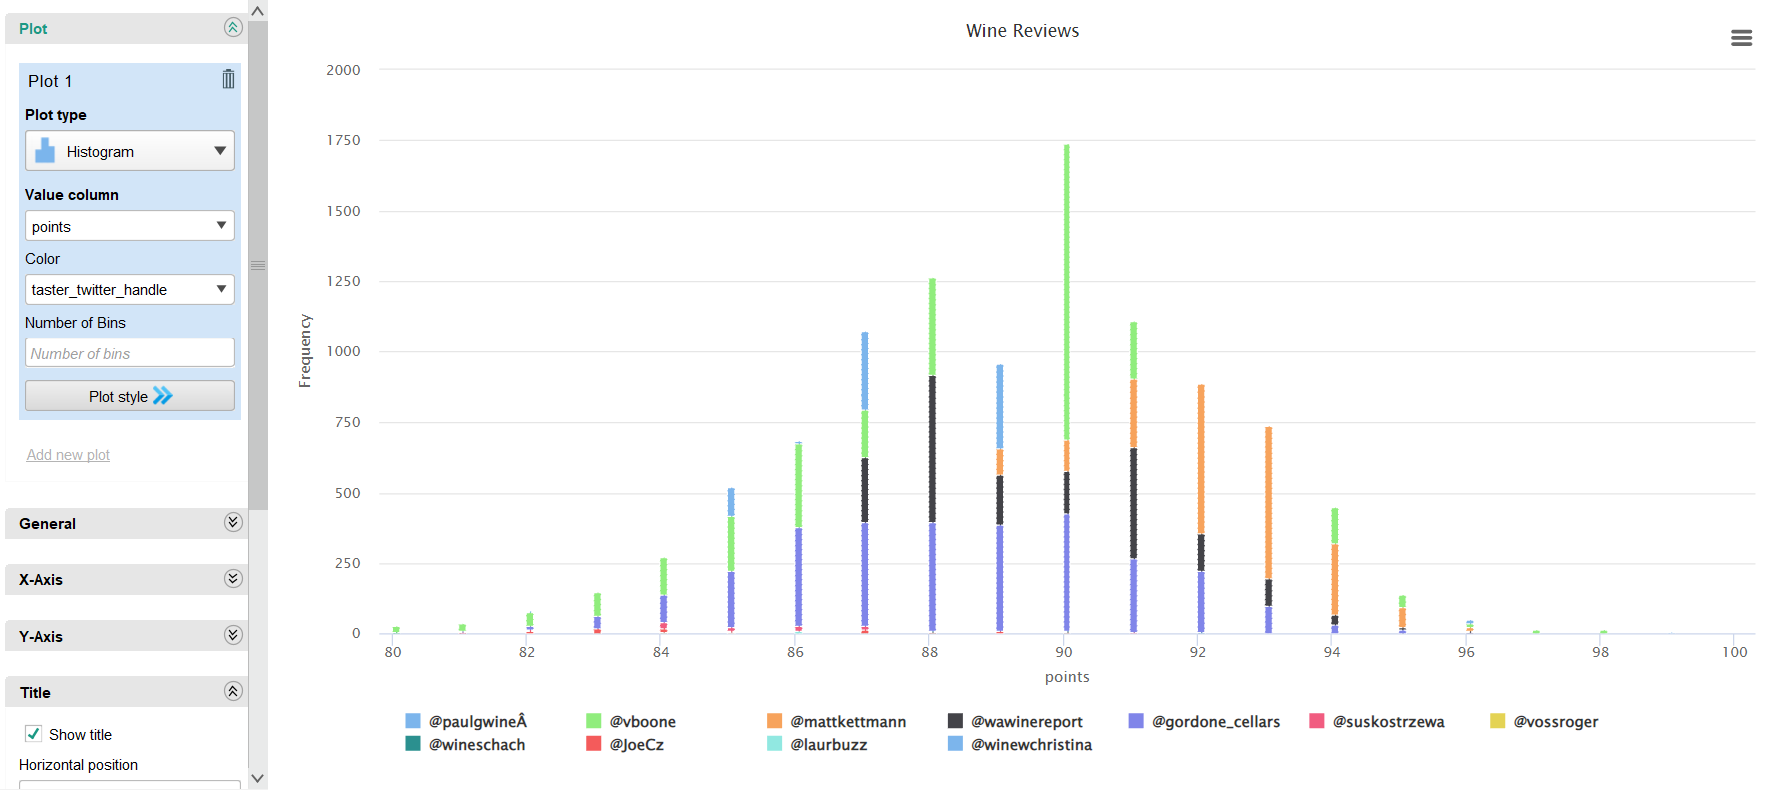
Points frequency histogram by taster Twitter handle
Scatter Plot — Winery Distribution by Region
Shows the geographic spread of wineries across regions, with Willamette Valley and California having the highest density.
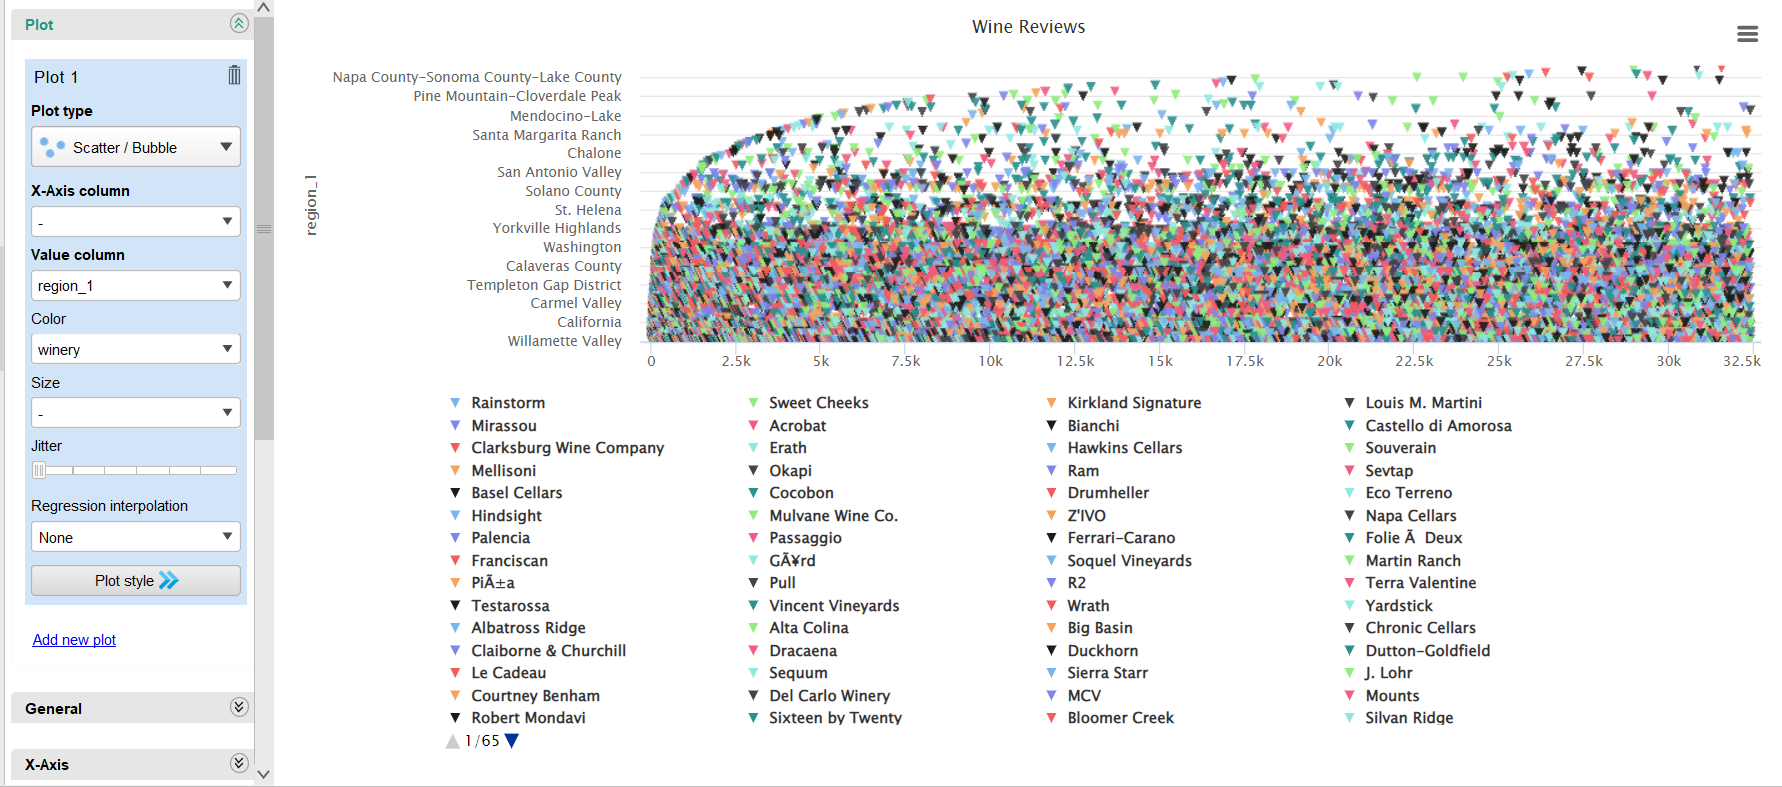
Winery distribution across US wine regions
Dataset Statistics
Full attribute-level statistics including missing values, min/max, and distributions.
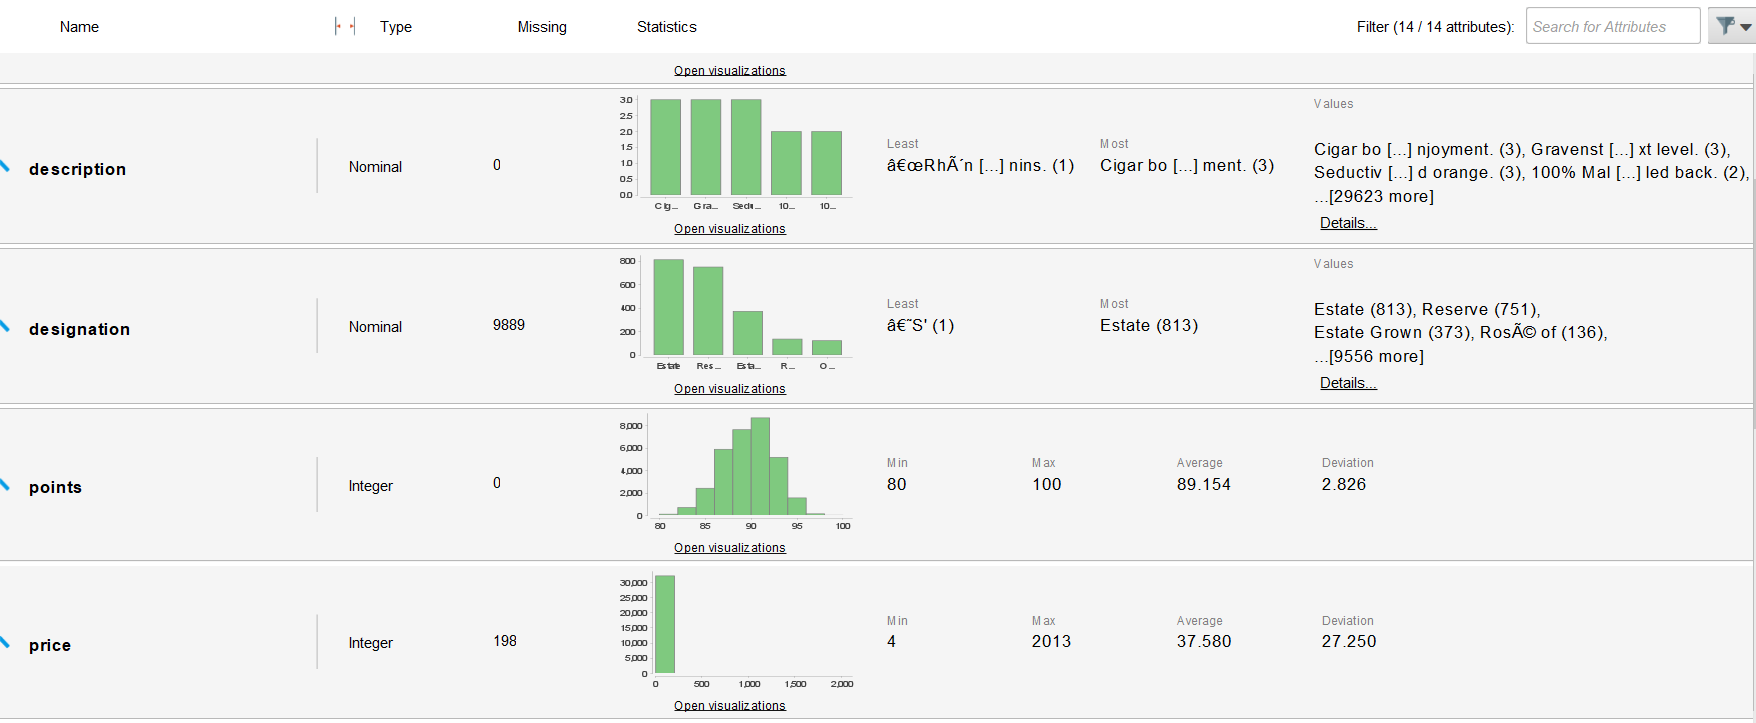
RapidMiner dataset statistics panel
Key Findings Summary
| Research Question | Finding |
|---|---|
| Price vs. Rating | Weakly correlated (r = 0.43) — price doesn’t guarantee quality |
| Best Province | California leads in average points among US provinces |
| Most Common Grape Blend | Bordeaux Blend dominates association rules |
| Wine Clusters | 5 clusters identified: Citrus, Fruity, Berry, Spice, Brand |
Insights & Business Value
This analysis provides actionable insights for wine industry stakeholders:
- Aspiring vintners can use the price-points correlation to position wines competitively without over-investing in premium pricing
- Association rules reveal which grape combinations dominate the market, guiding vine selection decisions
- Cluster analysis identifies distinct flavor profiles, enabling targeted marketing to different consumer segments
- Regional analysis shows California and Oregon as top-performing provinces — ideal targets for sourcing premium grapes
Limitations & Future Work
What could be improved:
- Gather a more diversified, cleaner dataset with balanced regional representation
- Apply sentiment analysis on review descriptions for deeper insights
- Build a predictive model to estimate wine variety, winery, and location from a description alone
- Explore TF-IDF and Word2Vec for richer text feature extraction
Author
Tejashwini Saravanan
📧 saravanant@spu.edu | 🎓 Master's Program — ISM6359 Data Mining [](https://github.com/TejashwiniSaravanan)License
This project was completed as part of academic coursework. The dataset is publicly available on Kaggle under its original license. This repository is licensed under the MIT License.